What is Computer Vision?
Alan Turing, the man who is credited with cracking the Enigma Code at Bletchley Park, once asked the question "can machines think?". This question has inspired multiple generations of data scientists and technological engineers who have one unifying focus: can machines simulate biology?
Computer Vision is one faction of this ideology, whose goal is to simulate the biological visual systems, with artificial intelligence processing the data to give a machine an understanding of the data without human supervision. To mimic how humans and other biological organisms process data, having an understanding of the underlying system is paramount, so a better place to start with learning what is Computer Vision is the question what is vision?

What is Vision?
Humans and other biological organisms utilise the visionary senses in order to process light in the environment. Light itself is a form of energy, referred to as the electromagnetic spectrum; as light travels in waves it can be measured in terms of wavelengths, where the energy decreases as the wavelengths get longer. There are 7 sections to the electromagnetic spectrum, in order of highest energy (shortest wavelength) to lowest energy (highest wavelength) they are: Gamma Rays, X-Rays, Ultra-Violet Radiation, Visible Light, Infrared Radiation, Microwave, and Radio Waves.
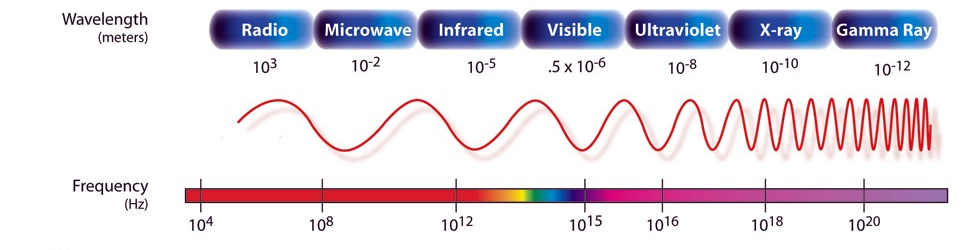
As the section name suggests, humans can only see the light with the wavelengths in the ranges of the visible section of the electromagnetic spectrum. But how?
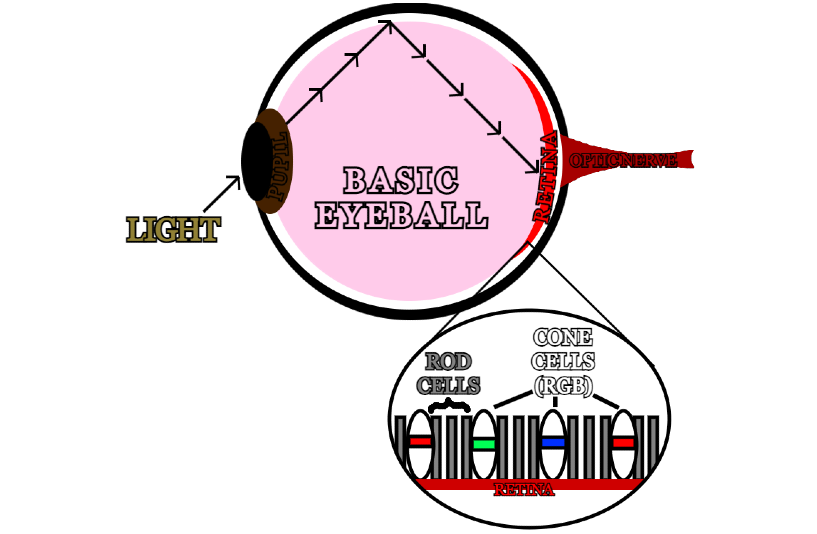
The human eye is spherical in shape with a circular hole at its front called the pupil, allowing light to enter and reflect off the inner surface and onto the back of the eye. Coating the surface at the back of the eye are two main types of cells, referred to as rods and cones. Rods work at low intensity light settings, allowing people to see in the dark; due to their high sensitivity to photons, they only produce greyscale images for the brain, however they are required to help with depth perception and night vision. The human eye has roughly 100 million rod cells, as opposed to the approximately 6 million cone cells which require much more light but can see colour.
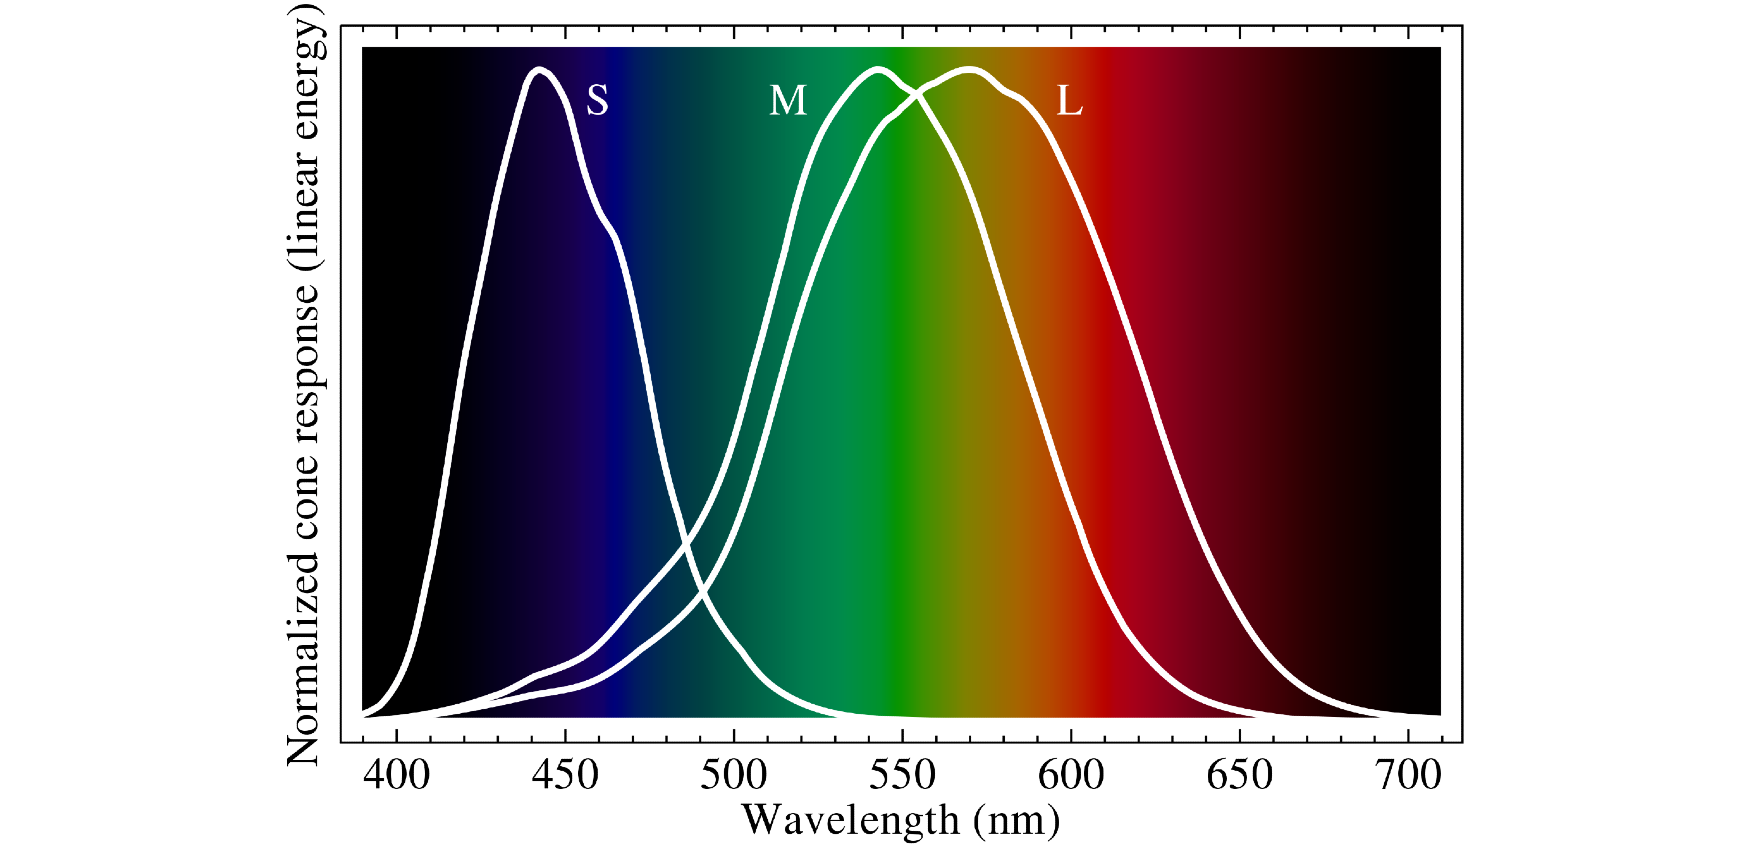
There are three types of cone cells, each one sensitive to a specific wavelength of visible light. Whilst the specific sensitivities varies for each person, the colours are universally recognised as Red, Green, and Blue. As light hits the back of the eye, they activate the corresponding cone cells, sending an electrical signal through the synaps to the optical nerve. As there are roughly 6 million cone cells in the retina, they create a pixel grid image in the brain with a resolution of roughly 576 megapixels with full RGB colour. Now we know what the basic biological concept of vision is, how does that translate to computer vision? What is colour?
What is Colour?
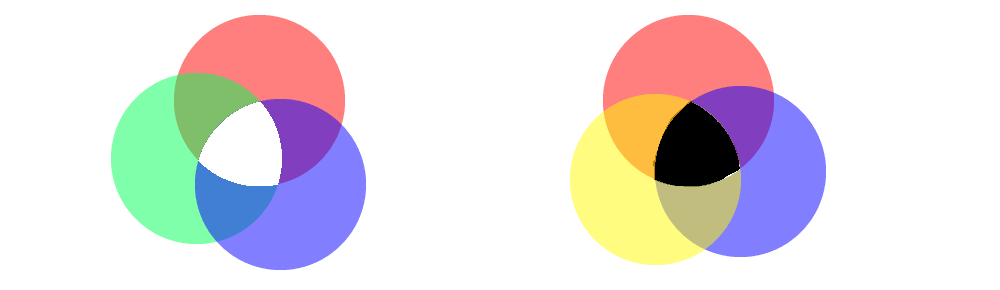
At this point it's good to mention light models, there are two models to be aware of when mixing colour intensities to produce specific colours, these are the additive and reductive light models. Essentially when mixing light sources with an additive model, adding red, blue, and green light together will produce white, whereas mixing red, yellow, and blue in a reductive (light absorbing) model will produce black. This is important to note as computer monitors display their results in an additive manner.
After the discovery of the three sensitivities to specific wavelengths in the human eye (also known as the Trichromacy Hypothesis) by Thomas Young back in 1801, it would be just shy of half a century before the theory was both proven and built upon. In 1850 Hermann Von Helmholtz classified the three sensitivity photoreceptors as short-preferring (violet), middle-preferring (green), and long-preferring (red). It would take all three lights at various intensities to produce all the colours and their hues visible to humans, creating the Young-Helmholtz Theory.

Skipping forward a couple of years to 1853, colour was still only thought of as wavelengths and intensities, at least until Hermann Grassman developed both the idea of vector space, and then the algebraic representation of geometric concepts in vector space. He stated that light and colour could be represented as a convex cone in 3-Dimensional linear space. This was not picked up on again significantly until 1999, when Microsoft and Hewlett Packard teamed up to develop the standard RGB colourspace (sRGB) to use on computer monitors, in printer inks, and the internet. To this day, sRGB remains the default and assumed colourspace of images unless they're tagged otherwise in their metadata.
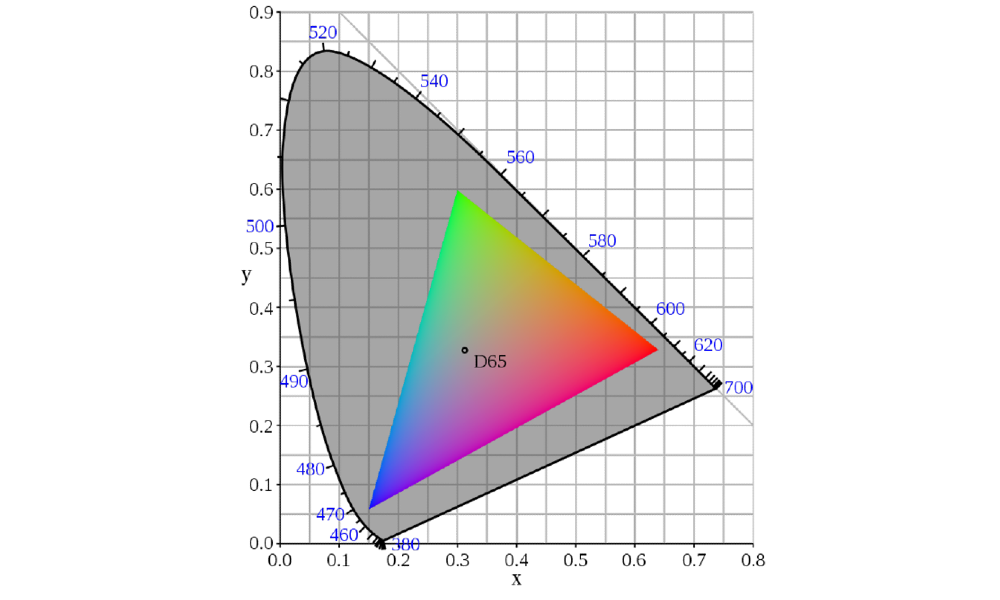
We define the three primary colours of the additive light model as each vertex of a triangle in vector space, then the gamut of the defined colourspace is the area within that triangle. Each colour has a 3-Dimensional vector coordinate point in this graph, represented by a value between 0 and 1. When these values are stored in 8-bit memory, they take a value between 0 and 255, creating the common RGB colour pickers we see in modern art software. Now we have a basic understanding of colour, but how is this translated into pictures? What is an image?
What is an Image?
At the time of writing, computer monitors are 2-Dimensional screens which use geometric manipulation to display 3-Dimensional full-colour images. But how? A screen consists of a grid of pixels, each with a cartesian (x, y) coordinate. Unlike normal graphs, the Origin of a screen pixel is in the upper left corner, with Y increasing in a downwards direction.
In an image, each pixel will contain a colourspace vector, dictating to the screen which colour that pixel should be. For ease, assuming it is a default sRGB image, each pixel will have an R (red) channel, a G (green) channel, and a B (blue) channel with a potential α value between 0 and 1 for opacity. In essence, an image can be thought of as a 3D matrix, with dimensions width x length x 3. Now we know what vision is, what colour is, and what an image is, the question remains how can we process what is in an image?
What is in an Image?
It is exceedingly rare for an image to show something incomprehensible to the human brain, so how does the brain do it? An image is made up of a few simple concepts that help the brain identify the subjects within an image. These are colour, texture, and shape; but how are these features extracted?

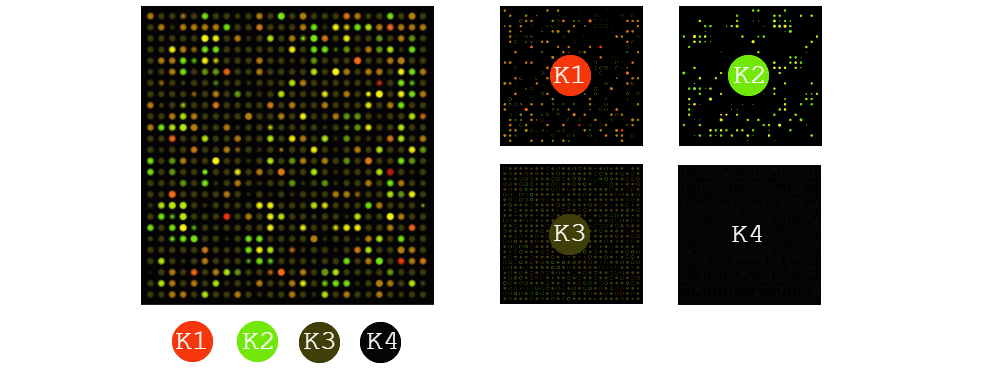
If the main subject of an image can be identified by colour and colour alone, then image segmentation should suffice. The simplest method is K-means segmentation; this machine learning method can be used both supervised and unsupervised. It works by randomly assigning K nodes a random vector in the sRGB colourspace, and using Pythagoras theory to assign each pixel to a K node based on their shortest geometric colourspace vector distance. The average (mean) colourspace value is then calculated for all the pixels associated to each K node, and that replaces the initial colourspace vector for that node. This process is then repeated until either the maximum number of iterations is reached, or until the change in colourspace vector for each node is an insignificant value. Each node then represents K layers on an image, where their value can be used for identification processes or other data mining techniques.
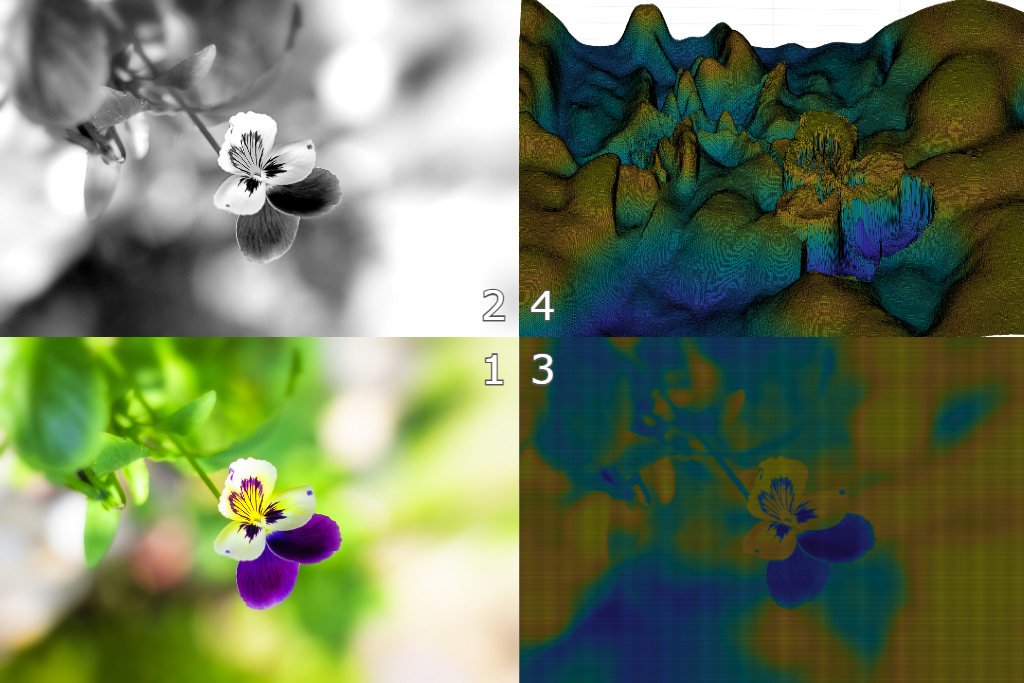
Shape is a little trickier to identify. There are various shapes within an image, such as circles, squares, triangles, and complex arcs. Something each of these shapes contain is an edge. An edge can be defined as an area of a 2D plane where the intensity gradient undergoes a steep change. For simplicities sake, I'll only be looking at edges from greyscale images; this can easily be achieved in MatLab with the 'rgb2gray()' function. If you want to have a look at a greyscale image in MatLab, use the 'surf()' function.
Apologies if you're reading this, it's a work in progress to be continued shortly with Sobel & Canny edge detection.